How to evaluate interaction costs and improve UX.

Letter
Interaction Design as a Skill-set
There are three core skills that every modern product design must master: product thinking, visual design, and interaction design.

In general, you should be good at all three, but master two. Most designers can teach themselves visual design and product thinking through online resources, practice, and shipping real products.
As a product design lead at a FAANG company that has mentored hundreds of aspiring designers, interaction design tends to be the most challenging core skill for designers to self-learn.
In this article, I provide a foundation and framework for learning and improving your interaction design skills.

—
Defining Interaction Cost
The foundational concept behind interaction design is “interaction cost,” which is often used to measure a product’s usability. Nielsen Norman defines “interaction costs” as the sum of mental and physical efforts that users must exert to reach their goals.
In general, we want to keep interaction costs as low as possible. However, this is difficult, as the more use cases your product covers, the harder this becomes.
Supporting more use cases and functionality adds complexity to your product’s information architecture (IA) and navigation. A use case is a sequence of steps, starting with a user’s goal and the result when that goal is achieved.
A more complex IA will inherently increase the number of clicks required to accomplish a user’s goal. For example, an iOS clock app has the following alarm use case goals: turn on the alarm, create a new alarm, and edit the alarm.

The rule of thumb focuses on reducing the interaction costs for your target user’s primary use cases. Whenever a product accommodates too many use cases (e.g., enterprise products with a million dropdown menus and features), it becomes harder to use. Choose a specific user and use case to focus on when building a brand new product.
Physical and Mental Interaction Costs
Most junior designers have this misconception that interaction cost equals the number of clicks required for a user to complete a task.

However, it goes much deeper than that. Interaction cost can be classified as mental interaction costs (MIC) and physical interaction costs (PIC), which I’ll explain below.
Find the Critical User Flows First
A best practice is to identify the primary use cases (i.e., red routes) and reduce its interaction costs at the expense of secondary and tertiary use cases if necessary.
You can use a Red Route Analysis (RRA) to assess which use case interaction flows are most important to your primary users.
Red routes tend to be critical, encompass end-to-end tasks with multiple steps, are often used, built for high volume usage, provide the most value, have clear success criteria, and tie to product metrics.

For instance, in the Uber app, the rider’s red route would be requesting a ride, while their normal route would be adding a payment method.
Tesler’s Law
According to Tesler’s Law of Conservation of Complexity, all systems have an inherent complexity that cannot be removed or hidden.
Good design ensures as much of the complexity burden is on the system rather than the user.

You should begin by reducing the interaction costs within the primary use cases and shift the complexity burden towards the least important use cases.
Tesler argued that a designer and engineer should spend an extra week reducing an application’s complexity rather than making millions of users spend an additional minute.
Be careful not to simplify interfaces to the point of abstraction. A common pitfall is reducing the PIC at the expense of the MIC; I’m looking at you, Apple.
When the system has handled as much of the inherent complexity as possible, you should shift the rest of the complexity away from the primary use cases to the secondary and tertiary use cases.
Most digital products have complicated settings for this reason. In most cases, settings are usually a tertiary use case and very rarely used.
Imagine if you always saw the settings screen instead of the home screen and needed to click several times to get to the screen you needed instead. You’d probably be frustrated at the unreasonable interaction costs.
Mental Interaction Costs (MIC)
Mental interaction costs (MIC) are often overlooked by junior designers who only pay attention to physical interaction costs (PIC).
Common MIC that you may have noticed in products with poor usability include complex navigation, dense instructions, unconventional mental models and interaction patterns, etc.
Attention and Memory
The two most important components of MIC are attention and memory.
When a task requires excessive attention or memory to complete, it will have a proportionally high MIC — decreasing usability.
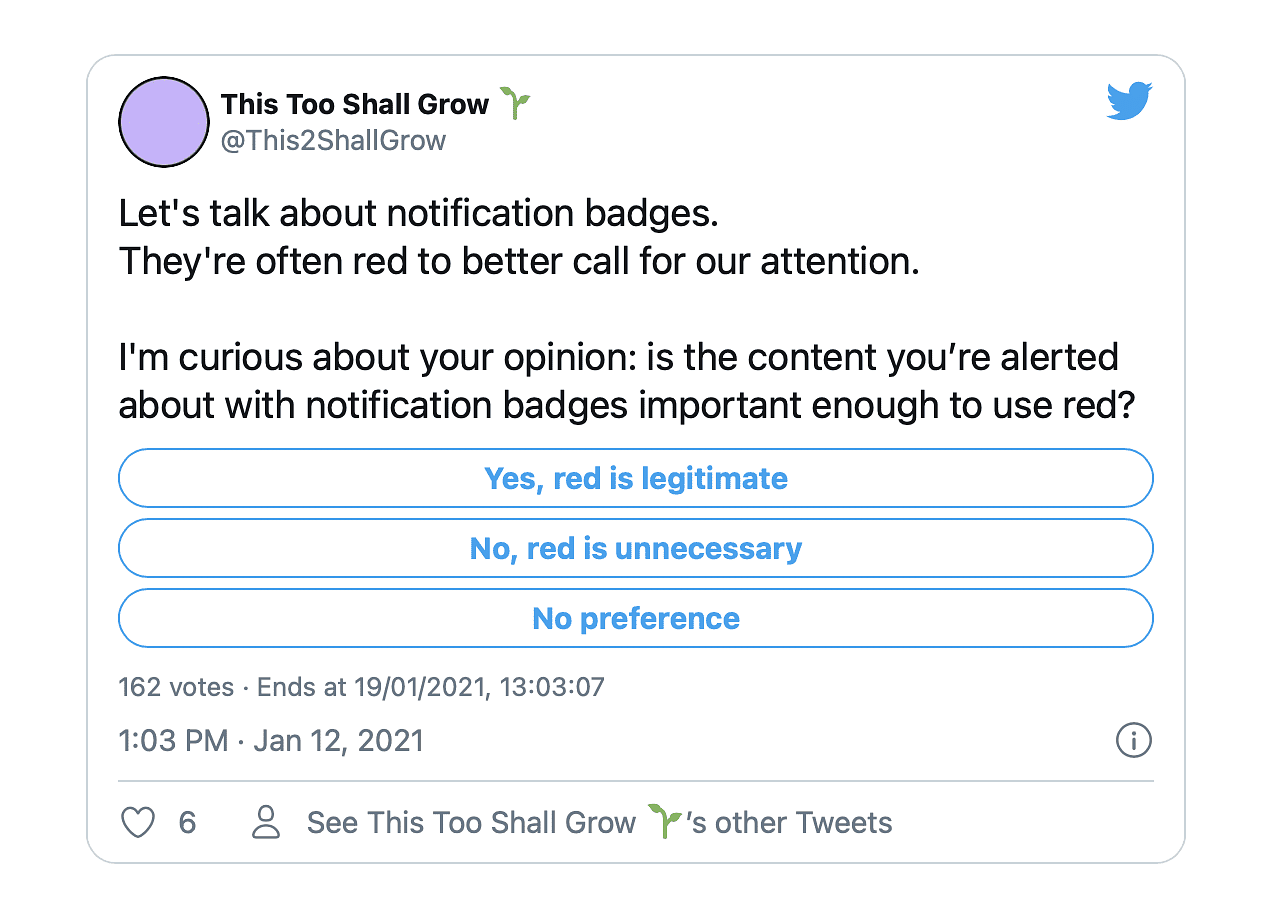
Some common elements that increase attention costs or divert attention include pop-up banners, models, attention-grabbing visuals, and motion unrelated to the user’s current task. Users are easily distracted. Make sure you’re not pulling their attention elsewhere when they are trying to complete a task.
Evaluating Attention
If you want to evaluate how much attention MIC your interface has, consider doing an eye-tracking study (ETS). You can use ETS to infer not only where users look but what they’re thinking.

The ETS examines two relevant eye movements in particular: “fixation” and “saccade.” Fixation occurs when a user’s pupils linger over an interface element long enough to process it. A Saccade occurs when the eye is in motion — darting between various areas within your interface.
If your ETS reveals many task-irrelevant saccadic movements, it’s likely due to a distracting interface. Your ETS results can help you understand if users are missing critical elements within the interface, what’s distracting, and what’s unnecessary.
Working memory
There is an extensive classification for all the different types of memory.
For our purposes as a designer, working memory (part of short-term memory) is the most relevant. The shortest type of memory is known as working memory, which typically only lasts a couple of seconds during a task.
In other words, our working memory is responsible for the information we can hold in our heads while we engage with other cognitive processes.
Miller’s Law states that the average person can only keep 5–11 items in their working memory at a time. The working memory required to complete a task within your product is proportional to the MIC burden you impose on your users.

Conversely, at no point should your task require the user to hold more than seven items in their working memory at any moment.
In rare scenarios where you require the user to hold more than 11 items in their memory, use “chunking” to reduce their mental burden. Chunking is when individual pieces of an information set are broken down and then grouped in a meaningful whole.
For example, we remember phone numbers as XXX-XXXX rather than XXXXXXX. It’s easier to remember the number in two chunks rather than a series of seven individual units.
Another factor related to consider related to attention and memory is “Hick’s Law.” The law states, “the time it takes to make a decision increases with the number and complexity of choices.

Avoid overwhelming users with excessive choices, highlight the best option for them whenever possible. Break complex tasks into smaller steps, i.e., using progressive disclosure when appropriate.
Physical Interaction Costs (PIC)
I won’t go into too much detail on PICs because most designers understand them well.
Common PIC factors include reaching distance and target width (Fitt’s Law), number of user inputs and actions required to complete a task, etc.
Fitt’s Law states that the time to hit a target (e.g., clicking on a button) is a function of the distance from your input device and the target’s hit-box width.

For example, clicking on a button on the desktop would take much longer if your mouse cursor was far away and the button was tiny.
An excellent method to assess PIC is “task analysis” and examining usability metrics such as “task time (TT).”
The root of TA is looking at the number of tasks required to complete the user’s goal, the frequency of those tasks, the physical requirements, and the task time.
TA and usability metrics are advanced topics that warrant an entirely separate note, so I’ll save it for next time.
Common Pitfalls to Avoid
According to Nielsen Norman Group, some of the most common aspects of a product that result in increased interaction costs include the following:
- Excessive reading and scrolling
- Looking around to find relevant information user
- Comprehending information presented to the user
- Physical user inputs
- Page loads and waiting times
- Attention switches
- Memory load
Situational Interaction Costs
The pitfalls mentioned above may be more or less critical depending on the user. For example, dyslexic users find reading more challenging than the average user (pro-tip: use a dyslexic friendly font like “Dyslexie”).

Users with motor impairments might find clicking much harder than reading. Even the user’s device can play an important role. For instance, a page load on a mobile device may take forever if the cellular coverage is slow.

Interaction Paths and Motivation
In some situations, there are multiple possible paths a user can take to accomplish their goal. Users decide which path to take based on the concept of “expected utility,”; defined as expected utility = expected benefits — expected interaction costs.
In other words, users weigh the benefits and costs of each action and choose the path that has the best balance of benefits versus cost.
Users will gravitate towards the path that has the lowest estimated interaction cost. Even if there’s a lower-cost path, if that path is unintuitive or unfamiliar, they will end up choosing the path they are more familiar with due to lower MIC.
Users with a high motivation (e.g., due to your marketing or branding efforts) are more likely to put up high interaction costs to complete their goal. For example, if Apple’s website had high interaction costs, users may still be motivated enough to complete their task.

However, if users wanted to purchase a generic product, and the checkout process had a high interaction cost, they will buy it from a competitor instead.
For more details, take a look at Nielsen Norman Group’s example of how to assess the interaction cost of a use case, “finding out where the word ‘ceremony’ comes from.”
Conclusion
Interaction cost is a vital skill-set for any modern product designer. I encourage you to go beyond the superficial interaction design considerations and delve deeper into the numerous PIC and MIC factors.
Of course, we should strive to reduce the interaction costs as much as possible, but when push comes to shove, we should make trade-offs to ensure the primary use cases have the least friction.
An excellent first step is to create a mental model of laws, frameworks, and tests to evaluate your design’s interaction costs.
If you liked this article, join my free newsletter “The Ambitious Designer” for more career & design insights.
I also run a private mentorship group on Facebook and a design Instagram account.