Build Design Systems With Penpot Components
Jul 21, 2:15 AM
Penpot's new component system for building scalable design systems, emphasizing designer-developer collaboration.
smashingmagazine.com
medium bookmark / Raindrop.io |
Product Designer at Behavox · pavelkuligin.ru
Nov 22

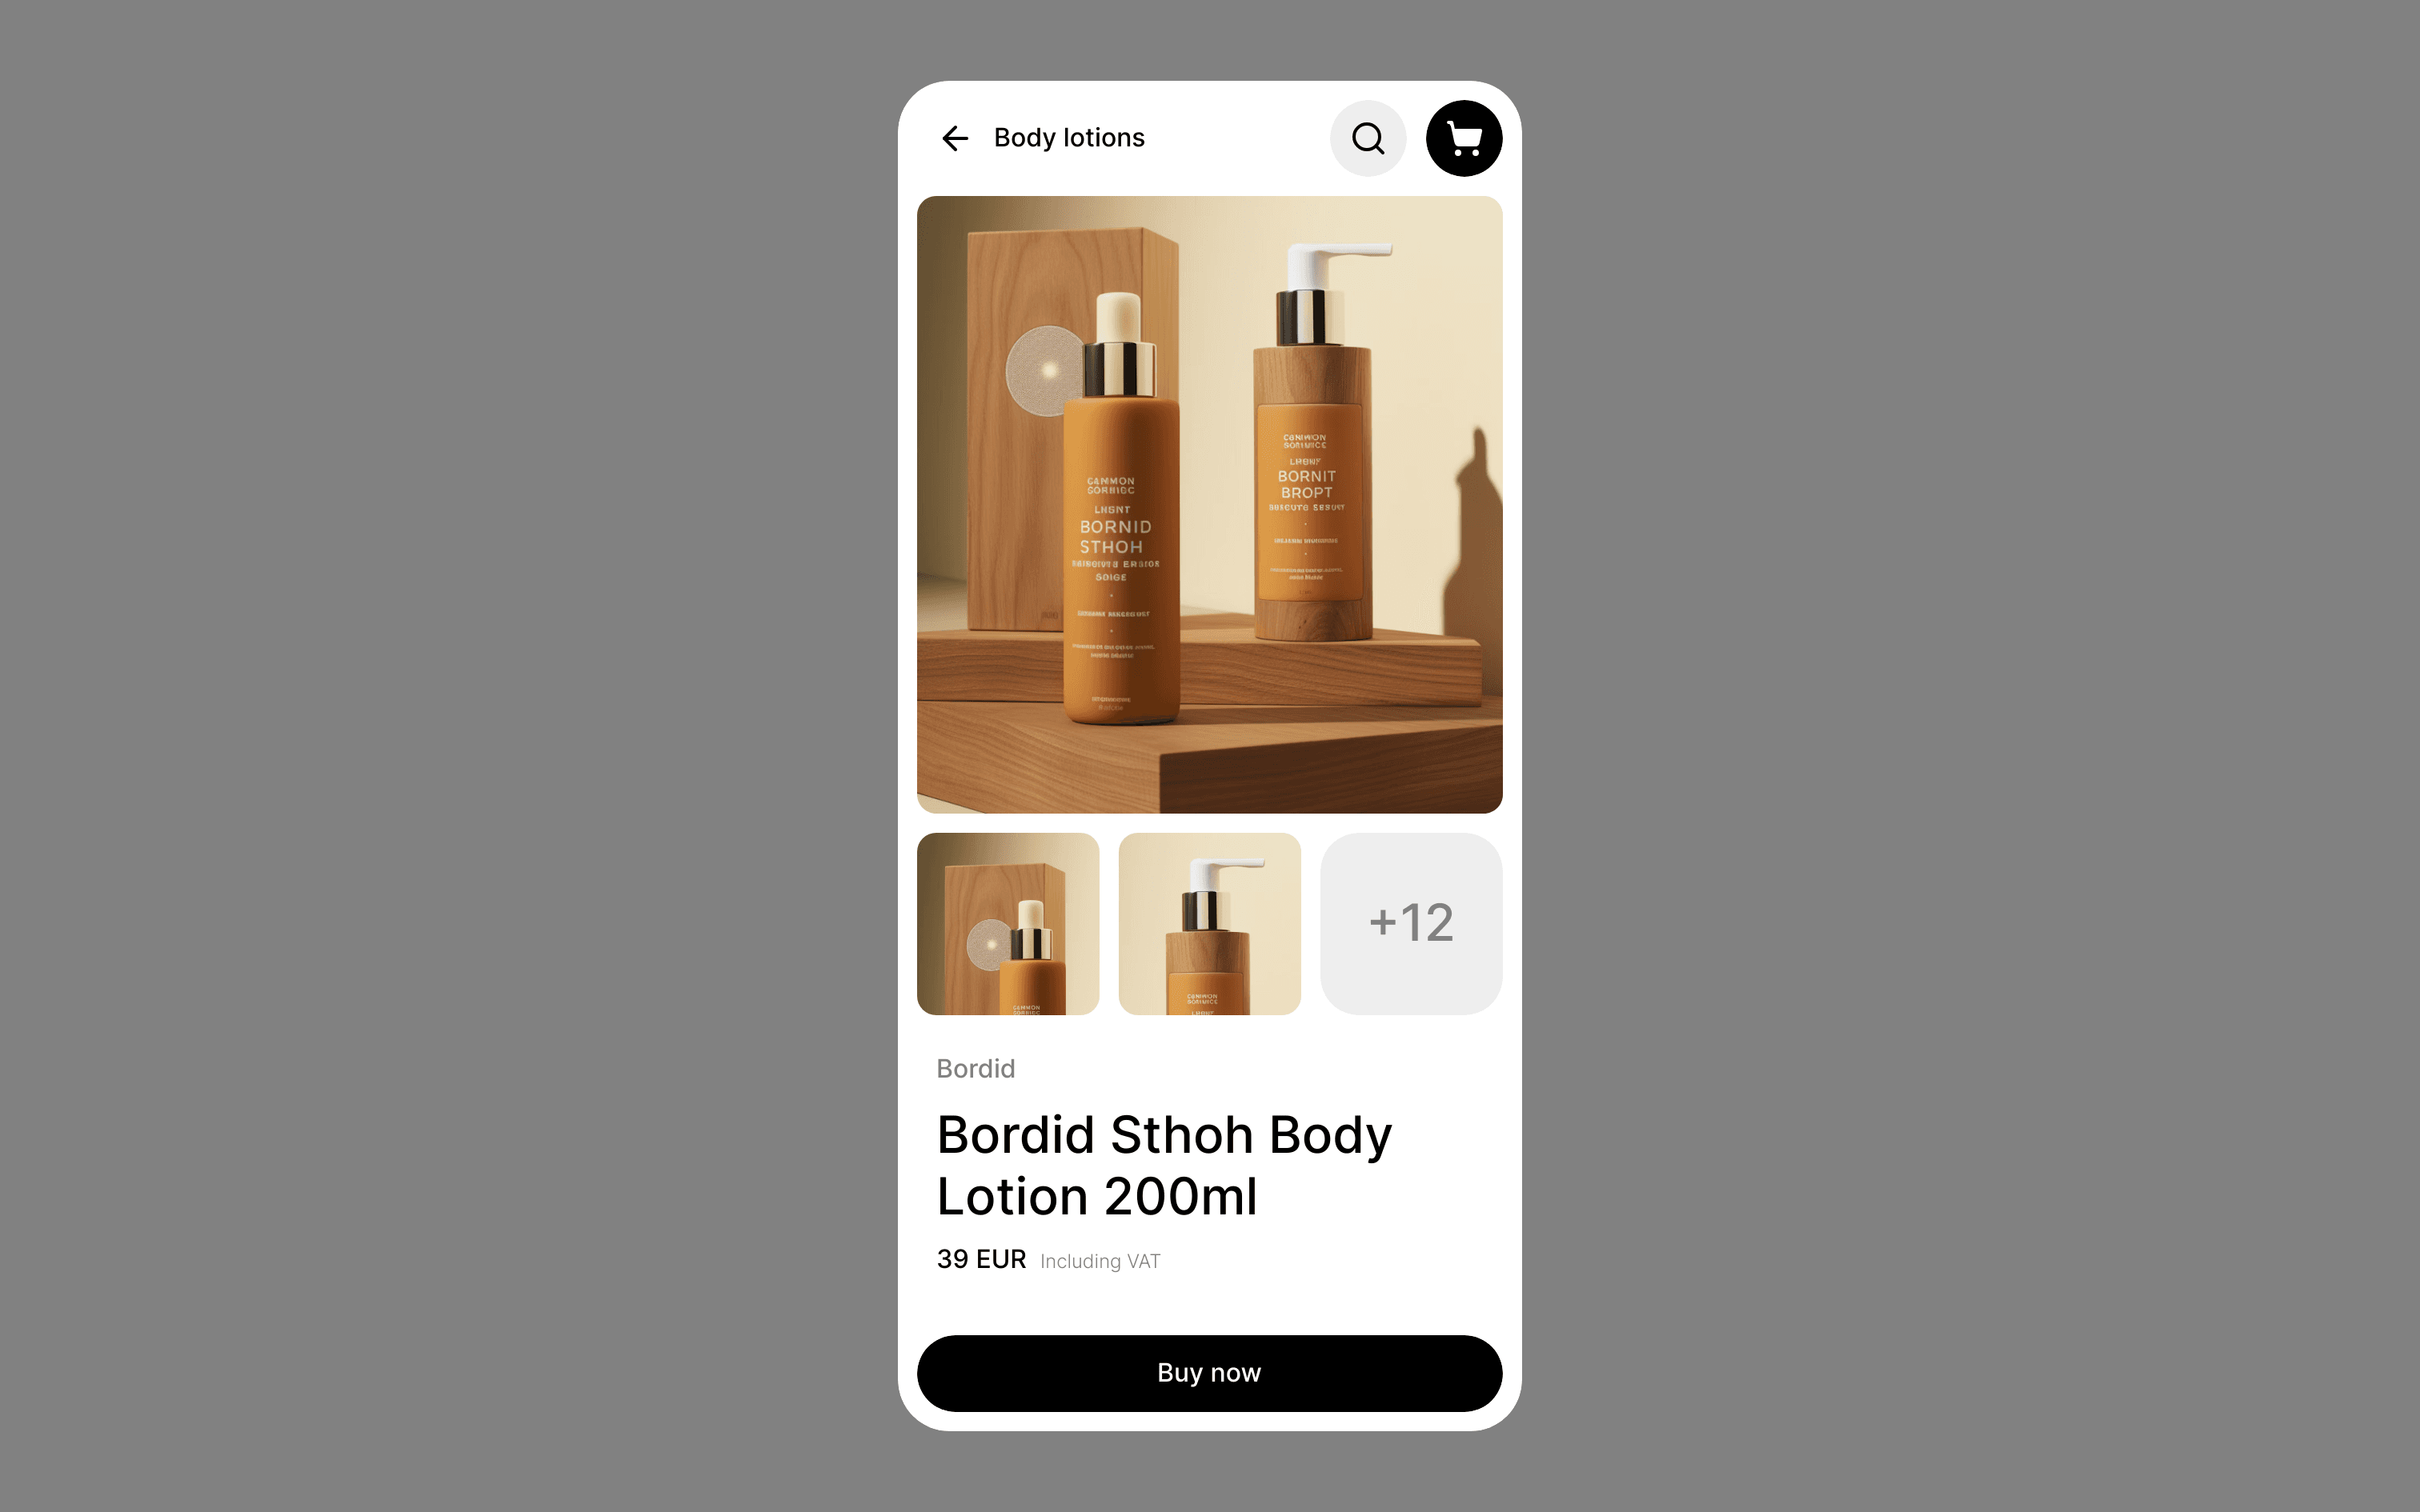
Data visualization is an important part of work for many interface designers. Dashboards, tables, reports and widgets — all of these interface components contains charts. No matter which tool you use, Sketch, Figma or Adobe XD, you don’t have built-in features for data visualization.
Imagine that you want to create a prototype for an analysis tool or a system with dozens widgets, tables or reports using real data from Excel. I spent a few weeks doing the same task. And one day our data scientist came to me and said that all data had changed! I was forced to make changes to the 56 screens in my prototype…
What alternatives did I have? I could use Tableau, D3.js or HTML Canvas, but these tools are complicated and not much flexible. I decided that I had to find a Sketch plugin which could solve my problem.
After searching for an hour I find three interesting plugins: Sketch Data Studio, Sketch Pies and Sparkliner. Each of these plugins had pros and cons, and they didn’t satisfy all my needs. So I decided to create my own Sketch plugin for my daily visualization tasks.
Chart contains four types of charts: Line chart, Bar chart, Area chart and Sparklines.
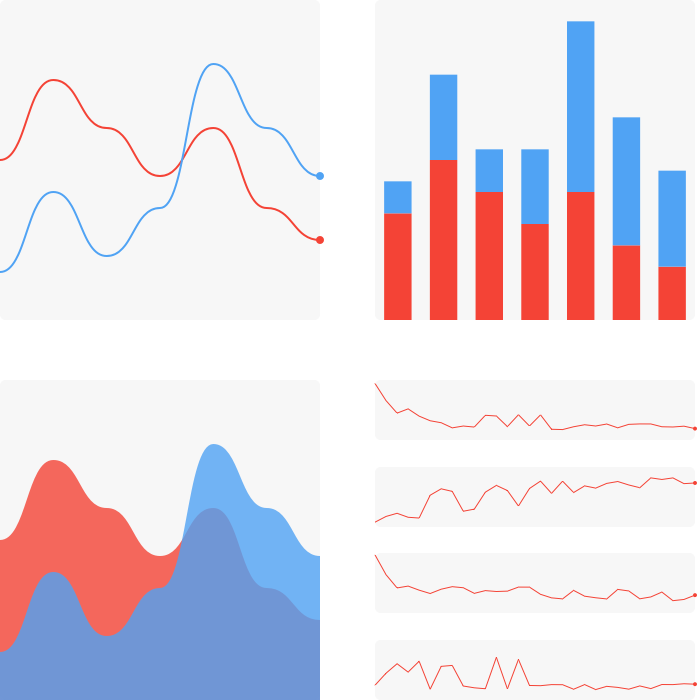
Each type of chart supports drawing on real text and tabulated or random data. You should copy numbers separated by commas from any text editor, Google sheet or Excel and create chart. If you select two or more strings, Chart will draw several lines on the canvas.
Inside Contents/Sketch you will find the file with common parameters like curve type, color palette or line weight.
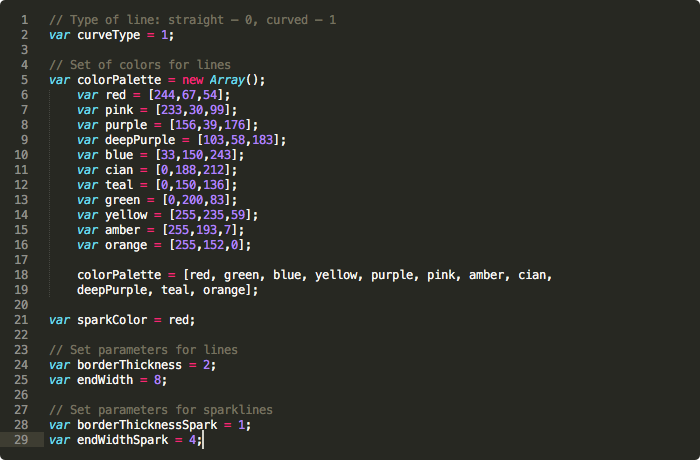
Chart/Contents/Sketch/parameters.js
Curving is based on Bezier curves. A random data generation is performed using several simple functions and their combinations:
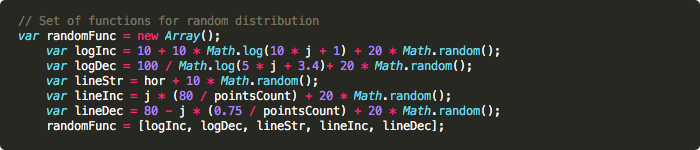
Combination of logarithmic and linear functions
Let’s create the Medical widget in 13 secs:
To try Chart, download and install Sketch plugin from Github.
Chart is a free and open-source project. If you find any bugs or have suggestions, feel free to contact me or fork the repository to add additional functionality.
AI-driven updates, curated by humans and hand-edited for the Prototypr community